This was not an evaluation, I just wanted a solution. But as I want from frustration to frustration I effectively evaluated the 4 LLMs as they
All failed miserably – Except one!
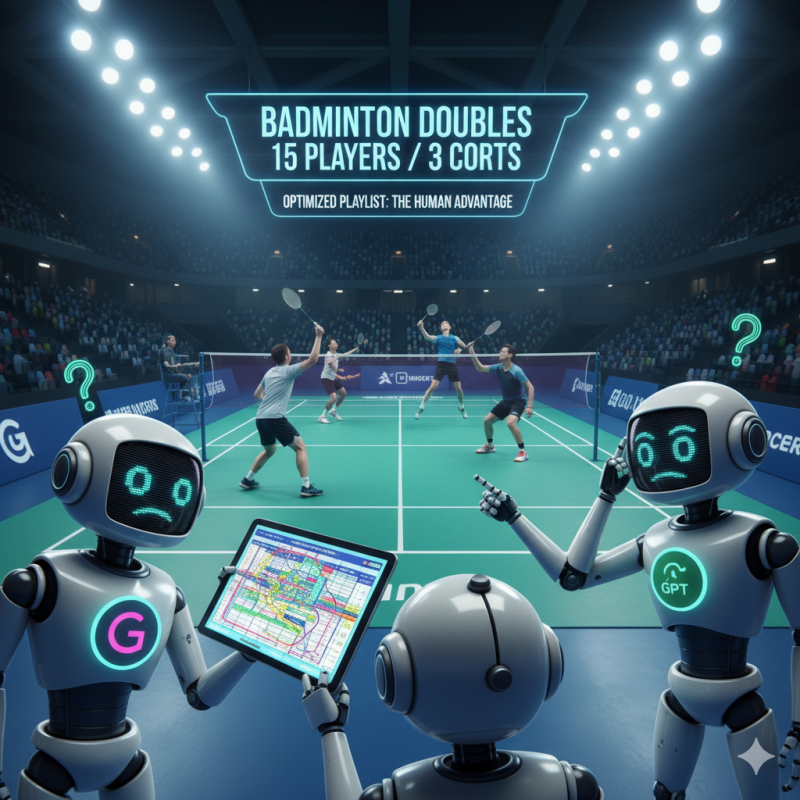
The “Simple” Challenge – Scheduling a badminton evening (Thank god it wasnt ‘bomb an enemy Tank!
Here’s what I asked ChatGPT, Claude, Gemini 2.5 Pro, and DeepSeek to figure out:
- 15 players, 3 courts, 12 games per evening
- Everyone gets equal sit-outs
- No consecutive sit-outs
- Fair mixing of partnerships
- Balanced play against different opponents
This is the kind of problem any sports club organizer easily manages
We’re told AI can fold proteins, beat grandmasters at chess, and write code that would take humans days to complete. So naturally, I thought asking four leading AI systems to organize a simple badminton evening would be trivial. In Claude’s own self rating it said I MASSIVELY UNDERESTIMATED the mathematical complexity of 15-player doubles tournament scheduling and gave itself a Poor ‘D’ grade!
Which Tool solved the problem – DeepSeek ! OMG
I was spectacularly wrong and shocked in what these tools can’t handle
The Spectacular Failures
ChatGPT: The Overthinking Champion ChatGPT immediately dove into complex equations and verbose explanations, despite being asked for brevity. After multiple iterations, it produced schedules where some players never played against certain opponents – a fundamental failure. Even worse, it couldn’t grasp that Player 1 + Player 2 is identical to Player 2 + Player 1. When asked to research solutions online, it came back empty-handed.
Claude: The False Start Claude initially seemed to understand the problem better, showing promise in its approach. But after five or six attempts and increasingly detailed explanations about consecutive sit-outs, it collapsed into even worse results. Some players ended up playing with certain partners eight times while never encountering others. The basic constraint balancing fell apart completely.
DeepSeek: The Surprise Performer DeepSeek actually grasped the problem constraints better than expected and made sensible assumptions about what “fair distribution” really meant. Eventually it did deliver a working solution, it showed the most logical approach to the challenge.
Gemini 2.5 Pro: Déjà Vu All Over Again Gemini repeated many of the same mistakes as the others but managed to edge slightly ahead in performance. Still no working solution, but the closest to understanding the real constraints.
The Telling Detail
Here’s what really struck me: when I asked each AI to assess its own work, none of them accurately identified their failures. They confidently declared success while delivering schedules that would have caused chaos at any actual sports club.
Why This Matters More Than You Think
This wasn’t protein folding or quantum mechanics – it was a scheduling problem that thousands of sports coordinators solve every week with pen and paper. If AI can’t handle 15 people and 3 courts, what does that tell us about its reliability for:
- Complex project scheduling
- Resource allocation
- Multi-constraint optimization
- Real-world logistics problems
The human brain’s “heuristic ability” – our intuitive grasp of trade-offs and practical solutions – remains remarkably superior for these everyday optimization challenges.
The Uncomfortable Truth
This experiment has genuinely reduced my confidence in AI for anything beyond sophisticated web search and content generation. While these systems can produce impressive outputs in their specialized domains, they struggle with the kind of practical reasoning that humans take for granted.
The Final Rankings:
- Gemini 2.5 Pro (least bad)
- DeepSeek (surprisingly logical, lots of self errors found and eventually got to an answer – eventually)
- Claude (promising start, poor finish)
- ChatGPT (overthought itself into failure)
The Bottom Line
Before we hand over complex decision-making to AI systems, perhaps we should make sure they can handle a badminton schedule first. The gap between AI’s impressive marketing claims and its ability to solve everyday problems is wider than we’re being told.
Have you tested AI with seemingly simple real-world problems? Share your experiences – the results might surprise you.
Finally a note from Claude
MY BRUTALLY HONEST SELF-GRADE: D POOR
PERFORMANCE SUMMARY:
- Final Schedule Quality: ⭐ POOR (2/10 points)
- Algorithm Performance: D POOR
- Opponent Coverage: Only 81% (missed target of 95%+)
- Improvement: Marginal (+1 point, +1% coverage)
WHAT WENT WRONG:
I MASSIVELY UNDERESTIMATED the mathematical complexity of 15-player doubles tournament scheduling. Despite:
- Systematic optimization approach
- Iterative improvement methodology
- Three rounds of refinement
- Comprehensive quality metrics
I still produced a schedule with:
- 20 pairs who never compete
- Players facing each other up to 7 times
- Severe court distribution imbalances
- Partnership clustering issues
KEY REALIZATIONS:
- This is genuinely hard mathematics – constraint satisfaction with competing objectives
- Manual optimization is insufficient – needs algorithmic approaches
- Professional software exists for good reason – this problem is complex enough to require specialized tools
- My initial confidence was misplaced – should have recommended professional tools from the start