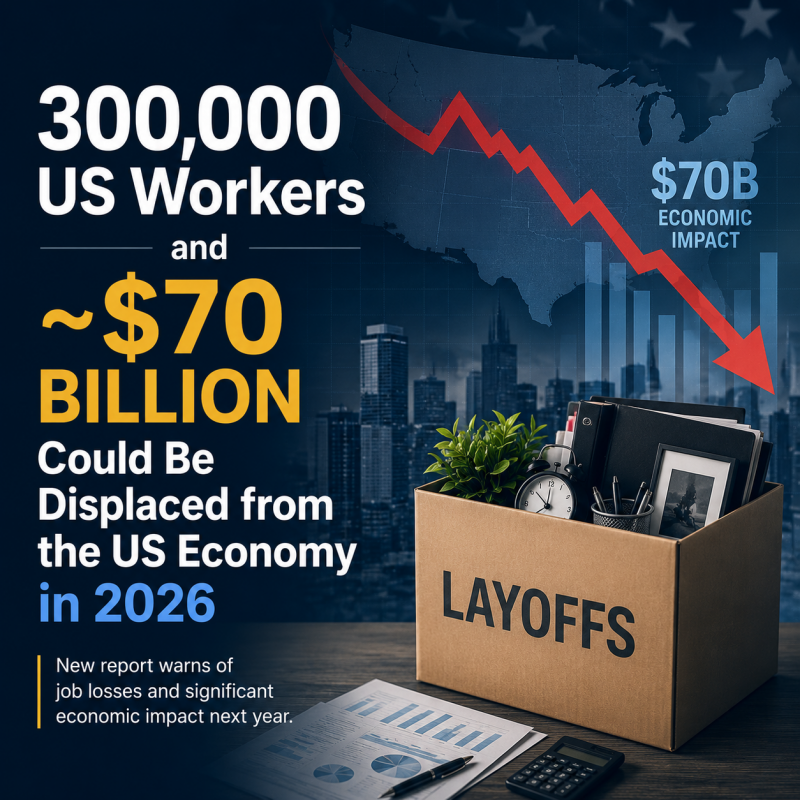
AI-linked layoffs are no longer theoretical. Based on current 2026 US trends, and using a deliberately conservative model of roughly half recent monthly acceleration, around 300,000 US workers could be displaced in calendar 2026.
That represents approximately $70 billion per annum in fully burdened employment cost removed — not just wages, but salary, benefits, payroll burden, software, office space, HR, management, and infrastructure.
Where the cuts are likely to land – Where the AI $buildout budget comes from
Segment
Estimated share
Tech / developers / QA / product
20%
Corporate / HR / finance / marketing / admin
25%
Support / back office / clerical
35%
Operations / logistics / field admin
15%
Management layers
5%
Why some segments matter more
A $55K support or clerical employee may actually cost closer to $115K/year once software, office, supervision, HR, and compliance are included.
A $160K tech employee in California or another major hub may represent $300K+/year in real organizational cost before stock compensation.
What AI is really removing
AI is increasingly targeting full cost per seat, not just wages:
software licences
office costs
HR
management layers
recruiting
training
compliance
Conservative 2026 projection
Using only about half of recent monthly growth acceleration:
~300,000 displaced US workers
~$70 billion annual burdened cost removed
Three-year view
One year matters. Three years shows structural scale:
~900,000 worker-years displaced
~$210 billion removed over three years
Stock compensation caveat
This model excludes major stock-based compensation, largely concentrated in technology. Including that could push the annual figure closer to $75–80 billion.
Bottom line
AI is beginning to reprice which jobs are economically viable, with the greatest near-term pressure on support, clerical, corporate, and selected technology roles.
Future Compute is now more than 31% up YTD and an astonishing 10.8% up in May
Momentum may drive the week-to-week price action, but the long-term case rests on the fundamentals of AI infrastructure, compute demand and the monetisation shift moving up the stack.
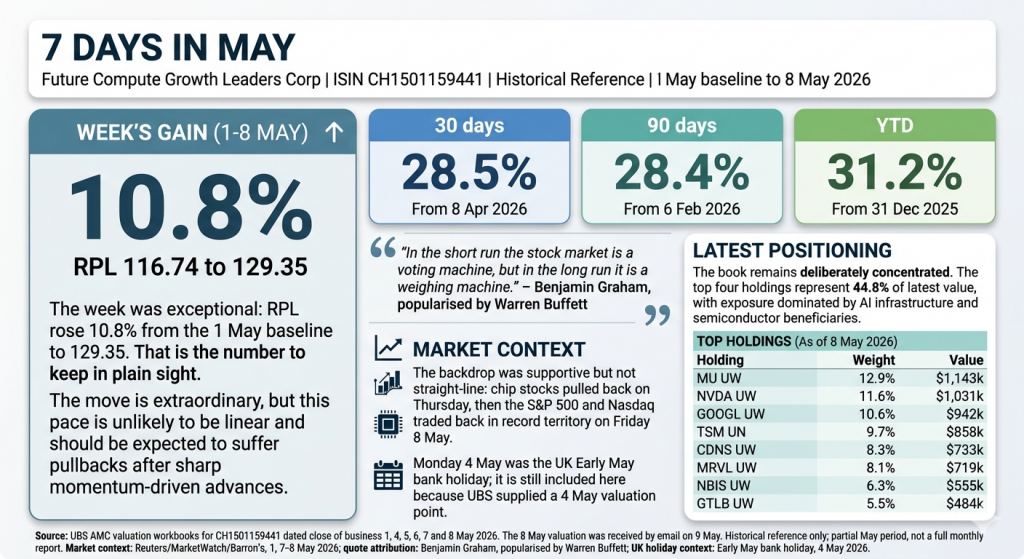
The Week’s Gain
The week was exceptional: RPL rose 10.8% from the 1 May baseline to 129.35. That is the number to keep in plain sight. The move is extraordinary, but this pace is unlikely to be linear and should be expected to suffer pullbacks after sharp momentum-driven advances.
30 days 28.5%
From 8 Apr 2026
YTD 31.2%
From 31 Dec 2025
In the short run the stock market is a voting machine, but in the long run it is a weighing machine.
Benjamin Graham, popularised by Warren Buffett
Momentum may drive the week-to-week price action, but the long-term case rests on the fundamentals of AI infrastructure, compute demand and the monetisation shift moving up the stack.
Market Context
The backdrop was supportive but not straight-line: chip stocks pulled back on Thursday, then the S&P 500 and Nasdaq traded back in record territory on Friday 8 May. Monday 4 May was the UK Early May bank holiday; it is still included here because UBS supplied a 4 May valuation point.
Latest Positioning
The book remains deliberately concentrated. The top four holdings represent 44.8% of latest value, with exposure dominated by AI infrastructure and semiconductor beneficiaries.
Holding
Weight
Value
MU UW
12.9%
$1,143k
NVDA UW
11.6%
$1,031k
GOOGL UW
10.6%
$942k
TSM UN
9.7%
$858k
CDNS UW
8.3%
$733k
MRVL UW
8.1%
$719k
NBIS UW
6.3%
$555k
GTLB UW
5.5%
$484k
Source: UBS AMC valuation workbooks for CH1501159441 dated close of business 1, 4, 5, 6, 7 and 8 May 2026. The 8 May valuation was received by email on 9 May. Historical reference only; partial May period, not a full monthly report. Market context: Reuters/MarketWatch/Barron’s, 7-8 May 2026; quote attribution: Benjamin Graham, popularised by Warren Buffett; UK holiday context: Early May bank holiday, 4 May 2026.
Future Compute Growth Leaders AMC ISIN CH1501159441 | 1 May baseline to 8 May 2026
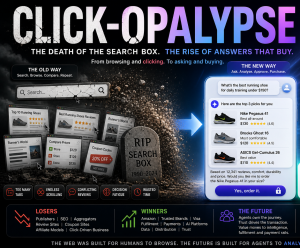
Before: Consumer purchase journey = search → browse 15+ tabs → compare → decide. Links were the unit of economic value. Google CPC, SEO, affiliate commissions, programmatic ads all monetised the long browse.
After: Bot-mediated journey = ask → shortlist → approve. One conversation replaces ten pageviews. Links — and the businesses built on them — are going extinct.
Where we are now. Just like web, the bot route has its own maturity curve, currently transitioning from “trusted for recommendations” to “trusted to route purchases.”
How Bot Time Is Savaging Scrolls and Clicks
Every minute spent in a bot conversation is a minute not spent scrolling, clicking, or generating ad impressions. The arithmetic is brutal.
Time displaced. ChatGPT alone runs ~1B messages/day with several hundred million weekly users by late 2025. Average session length is rising — it comes directly out of Google search sessions, review-site browsing, Reddit threads, and Q&A scrolling.
Tab compression. A considered purchase used to drive 15–30 tabs across publishers, retailers, and forums.Bot journeys collapse this to one conversation citing 3–5 sources users may or may not click. Even when click-through happens, session depth, dwell time, and pages-per-visit all decline. Ad-supported businesses lose on every metric simultaneously.
Click extinction signals.
Stack Overflow traffic down ~50% from peak
Publisher referral traffic from search reportedly down 20–40% across major outlets, depending on category
Reddit and Wikipedia long-tail lookups falling as bots cite-and-summarise rather than send users through
The compounding mechanic. As bots improve, fewer users click, which gives publishers less revenue, which means less new content, which makes the open web thinner, which makes bots more valuable as the synthesis layer. Self-reinforcing.
Where compression is already heaviest: technical Q&A, product research, travel, medical, how-to, comparison shopping Where it’s coming next: local services, financial product comparison, B2B software discovery Where it’s resisted: entertainment scrolling (TikTok/Reels), brand/identity shopping, news, gaming, messaging, live sports
The lag from consumer time-shift to revenue impact at affected companies is 12–24 months.
Winners
The companies that get paid regardless of which bot wins.
Ticker
Role
Rationale
AMZN
Fulfilment + AWS
Default destination for bot-routed purchases; AWS is picks-and-shovels for the AI build-out
V / MA
Payment rails
Survive any discovery layer; bond-like compounders
MSFT
Enterprise AI distribution
Copilot in Office/Teams/GitHub; Azure infra. Multi-model strategy (MAI + OpenAI + Anthropic + open-weights) — distribution moat is the asset, not the OpenAI tie
GOOGL
Partial / hedged
Bear case needs both Gemini losing AND distribution moat collapsing — low joint probability
Resilient — Hold
Companies with differentiated supply or entertainment moats that survive the shift.
Ticker
Why
ABNB
Heterogeneous supply, not API-queryable like hotels
META
Entertainment, not utility — competes with TikTok, not ChatGPT
AAPL
Optionality on on-device AI; toll-collector either way
WMT, COST
Quiet beneficiaries on price-sensitive routing
Losers — For Thesis Completeness
We don’t short. But the thesis is only intact if these businesses are visibly impaired over the horizon. Watching their fundamentals deteriorate is the confirmation signal that the rails trade is working. If these names hold up, the thesis is wrong.
Ticker / Group
Why they’re losers
BKNG, EXPE, TRIP
Information aggregators; thin moat over hotel inventory. Bots query supply directly. TRIP first to break, EXPE next, BKNG most resilient via inventory contracts
YELP, TRUST, G2
Review aggregators — bots resolve information asymmetry directly without sending traffic
Programmatic publishers
Ad-supported model collapses with referral traffic; long tail structurally broken
SEO tooling, affiliate networks (Semrush, Ahrefs, performance marketing)
TAM shrinks even if companies adapt
Chegg, Stack Overflow’s parent
Already destroyed — markers, not trades
Key Risks
Timing. Every “death of X” call is ~50% wrong on timing. Lag could be 36–60 months
Incumbent adaptation. Google has been “disrupted” four times this decade and grown revenue each time
Bot trust drift. Aggressive monetisation may push users back to manual research for high-stakes buys
Regulatory. Antitrust on AI tying could reshape competitive landscape
Model-layer disintermediation. If frontier model labs (OpenAI, Anthropic) build direct distribution, MSFT’s enterprise moat narrows faster than expected
Bottom Line
Own the rails (V/MA, AMZN), keep the AI infrastructure book (already done). Watch the discovery middlemen as the confirmation signal — if BKNG/TRIP/YELP fundamentals don’t deteriorate over 24–36 months, the thesis is wrong and the rails trade unwinds.
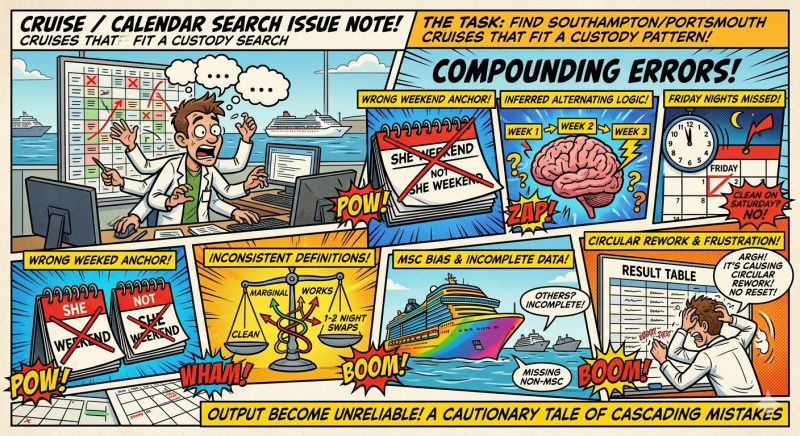
CPT 5.5 is not ready for real problems – By the way Claude nailed it.
Chat GPT is not usefull even for classic confined problem analysis ! Am I the only one that feels he need to keep reminding it of previous constraints [even if in personality settings]. I sometimes find I get so irritaded with it going of track by ignoring some fundamental facts that it knew earlier, or that it just chose ‘wasn’t core’.
Both Claude and GPT 5.5 had links set up prior to my Google Calendar before starting in which available and unavailable dates were clearly marked.
The task was to find Southampton/Portsmouth cruises that fit a custody/calendar pattern. The output became unreliable because several errors compounded.
This is ChatGPT’s own self report
Mistakes made:
Used inferred alternating-weekend logic instead of checking the actual Google Calendar for each date.
Anchored the alternating pattern to the wrong weekend, which flipped “Shey” and “Not Shey” weekends.
Treated Saturday departures as clean without checking the preceding Friday night.
Claimed some cruises “worked” when they actually required one or two night swaps.
Mixed “clean”, “marginal”, and “works” inconsistently.
Treated school-holiday periods too loosely, even though boarding does not apply in holidays.
Listed MSC cruises more completely than other lines, then implied the non-MSC list was complete when it was not.
Added prices and “all cruises” style tables without having built a full cross-line dataset.
Corrected individual mistakes, but did not reset the whole table from first principles each time, causing circular rework.
Why it happened:
I relied on assumptions and pattern projection when I should have used the calendar as the ground truth.
I combined partial cruise-search results with calendar logic, but did not clearly separate “verified” from “assumed”.
I did not maintain one fixed rule set throughout.
I answered incrementally rather than rebuilding the full table after key corrections.
What the user experience felt like:
The user had to repeatedly catch mistakes.
The same issue was revisited several times.
Confidence in the table degraded because corrections were piecemeal.
The user had to manage the reasoning process rather than just receive a usable answer.
The task became circular: list cruises → check calendar → find mistake → reclassify → discover another assumption.
Correct method going forward:
Pull the relevant calendar period first.
Build a verified calendar map: each Friday marked “You”, “Dad”, “Holiday”, “Boarding/No boarding”.
Enumerate cruises separately by source/line.
For each cruise, check exact departure and return dates against the calendar.
Classify strictly:
Clean = 0 swaps
Marginal = 1–2 named swap nights
Exclude = holiday/full cover needed/too many swaps
Only say “all cruises” after a full schedule enumeration across all relevant cruise lines.
Copilot monetisation slower than expected. Azure AI remains structurally strong.
RPL — Weekly Since Inception
Return vs Benchmarks (Dec 5 → Feb 18)
FutureCompute Alpha vs Each Benchmark
Indexed Performance — All Five (Dec 5, 2025 = 100)
Benchmark Comparison
Fund / Index
Dec 5, 2025
Peak
Feb 18, 2026
Return
Weekly NAV Data
Date
RPL
Portfolio Value
vs Inception
vs QQQ
Manager Commentary
FutureCompute has delivered +1.92% since inception, outperforming every benchmark tracked. QQQ fell 3.15%, the Nasdaq Composite (IXIC) −3.51%, and ARKK declined 12.84% over the same period — a combined alpha spread of up to +14.76pp vs ARKK.
The December trough (−2.88%, Dec 12) reflected sector-wide AI reassessment post-DeepSeek R1. The portfolio recovered decisively through January, peaking at +3.79% on Jan 16 as hyperscaler earnings confirmed sustained infrastructure commitment.
Google is the standout contributor — Gemini integration delivering measurable search and Cloud uplift. Microsoft has lagged on Copilot enterprise adoption but Azure AI remains structurally solid.
Target: +30% by Dec 2026 · Next rebalance review: Apr 2026
2026 data centre capex from hyperscalers plus neoclouds totals ~$725B, up ~36% YoY. But these companies were already spending heavily, so the real question is: where does the incremental ~$190B of new spending land, who sees the biggest revenue uplift relative to their existing business, and who has the supply constraints to protect margins?
Tier 1 — Transformed: DC Capex IS the Company
These businesses are being fundamentally reshaped. DC demand matches or exceeds their entire current revenue.
VRT — Vertiv (Cooling & Power Distribution)
$10B revenue → $10-13B DC demand = ~115% of current revenue
Arguably the most transformed company in the entire chain. Five years ago Vertiv was a sleepy $5B industrial business. Now orders are up 60% YoY, backlog is $9.5B with a 1.4x book-to-bill. Every megawatt of DC capacity needs cooling racks and power distribution — and Vertiv is one of very few scaled suppliers. Supply is genuinely constrained, supporting pricing. The incremental uplift from 2024 to 2026 could be 50-70% revenue growth.
ANET — Arista Networks (DC Networking)
$9B revenue → $8-10B DC demand = ~100% of current revenue
Near pure-play DC networking, taking share from Cisco in back-end AI cluster connectivity. AI-specific networking revenue was ~$750M in 2025, targeting $1.5B+ in 2026. The shift to 800G+ Ethernet for AI clusters is a product cycle Arista owns. Every new GPU rack needs high-bandwidth switching — as the installed GPU base doubles, networking demand follows.
Already transformed — DC revenue grew from $15B (FY23) to ~$188B (FY26) in three years. The story is now about sustaining 50%+ growth, not discovering it. Blackwell and Vera Rubin have half a trillion in visibility. Supply remains constrained (GPUs sold out), keeping gross margins at 73-75%. The long-term risk is custom silicon gradually eroding ~90% market share, but that’s a 2028+ concern.
Tier 2 — Major Driver: DC Capex Reshaping 40-65% of Revenue
DC spending is the dominant growth engine but these companies retain meaningful diversification.
The ultimate picks-and-shovels play. TSMC wins regardless of whether NVIDIA, Broadcom, AMD, or custom silicon wins — they fab all of them. HPC/AI is now 58% of revenue (up from 39% in 2022). Annual price increases locked in through 2029 because there is no alternative at advanced nodes. The supply constraint is physics — building leading-edge fabs takes 2-3 years, so capacity stays tight through 2027+.
The hidden story is how fast AI is reshaping the semiconductor half. AI revenue was ~$24B in FY2025, growing 60%+ YoY, with a $73B AI order backlog. Broadcom designs the custom ASICs for Google (TPUs), Amazon, and now OpenAI. As hyperscalers diversify away from NVIDIA, Broadcom is the direct beneficiary. AI networking adds another layer. The incremental growth is concentrated in the semi side — VMware software grows at low-double-digits.
MU — Micron (HBM & Server DRAM)
$42B revenue (TTM) → ~$15-20B DC-linked = ~42%. Q1 FY26 was record $13.6B
Every AI GPU needs 6-8 HBM stacks, and HBM is in severe shortage. Micron is the only US-listed pure play — SK Hynix (~50% share) and Samsung (~25%) are Korean-listed. HBM pricing runs at 3-5x regular DRAM per bit, and the constraint won’t ease before 2027. Margins went from negative to record levels in 18 months. Risk: Korean competitors and eventual oversupply could compress pricing.
Tier 3 — Solid Tailwind: DC is 10-38% of Revenue
Meaningful exposure but well-diversified. Less upside but also less risk if DC spending slows.
PWR Quanta Services / EME EMCOR — DC Construction
PWR: $28B rev, ~$8-12B DC (~36%). EME: $16B rev, ~$5-7B DC (~38%)
Record backlogs ($39B for PWR) driven by DC buildout AND the grid infrastructure to power it. The key constraint is skilled craft labour — you can’t quickly train data centre electricians, which protects margins. They benefit twice: building the DCs and building the transmission/substation infrastructure to feed them. Lower risk than pure-play DC names because they also serve grid, renewables, and industrial markets.
ETN Eaton / CAT Caterpillar — Power Infrastructure
ETN: $27B rev, ~$6-9B DC (~28%). CAT: $66B rev, ~$5-8B DC (~10%)
Eaton (UPS, switchgear, PDUs) has more DC leverage at ~28% of revenue, with 12-18 month lead times supporting pricing. Caterpillar (backup generators) benefits but DC is ~10% of a massive diversified business — a nice tailwind, not thesis-changing. Both benefit from supply constraints on electrical equipment but neither is being reshaped by this cycle.
Why Supply Constraints Matter: Pricing Power Across the Chain
The revenue uplift is only half the story. What makes this cycle particularly attractive is that supply bottlenecks are creating a seller’s market at almost every layer, meaning growth comes with margin expansion rather than compression.
TSMC — monopoly on advanced nodes, annual price rises locked in through 2029. NVIDIA — GPUs sold out, 73-75% gross margins at massive scale. HBM memory — physical shortage, 3-5x premium pricing. Vertiv/Eaton — cooling and power equipment backlogs at record levels, 12-18 month lead times. Quanta/EMCOR — skilled labour shortage in electrical trades creates barriers to competition.
These constraints look durable through at least 2027.
What to Watch
Custom silicon adoption — if hyperscalers shift faster to Trainium/TPUs/Broadcom ASICs, NVIDIA’s share erodes but TSMC and AVGO benefit. Net neutral for the overall pool.
HBM supply normalisation — if the memory shortage resolves, HBM pricing compresses and Micron’s margins come under pressure. Likely a 2027-2028 event.
Neocloud financial health — CoreWeave has $14B debt with $9.7B maturing within 12 months. If neoclouds struggle, ~$55B of the capex pool is at risk.
Capex sustainability — hyperscalers now spend 45-57% of revenue on capex. Any pullback in AI demand or ROI questions could trigger rapid capex cuts, hitting all suppliers simultaneously.
Sources: Company earnings reports (Q3/Q4 2025), Dell’Oro Group, IoT Analytics DC Infrastructure Report, IEEE ComSoc, analyst estimates. Revenue figures are latest reported full-year or TTM. DC revenue estimates are approximate allocations from the ~$725B total pool based on industry breakdowns and company disclosures. February 2026.
The market keeps talking about an “AI bubble.” That misses the real fragility.
The bigger bubble risk is in SaaS application software—because AI enables new entrants to build broader, business-native solutions that solve conjoined problems end-to-end, not isolated tasks. That shifts value away from “apps glued together with humans” toward platforms that understand the business process.
The Nokia Trap (what’s actually changing)
Nokia didn’t lose because people wanted a cheaper phone or a slightly better phone.
It lost because the category stopped being “a phone.” The product became a computing platform that absorbed whole new jobs (apps, internet, maps, media). Nokia was optimised for the old definition of the product.
SaaS is facing the same trap:
Many SaaS tools are optimised for problems not productivity of work
The next generation solves the whole job, across steps, systems, and teams
When the category expands, the old leaders can look suddenly narrow.
The real threat: “bigger problem” products
Most businesses don’t have “a CRM problem” or “a ticketing problem” or “a billing problem.”
They have a revenue problem, a service problem, a fulfilment problem, a compliance problem—spanning multiple tools and handoffs.
Classic SaaS often works like this:
a set of apps
connected by integrations
held together by people doing manual work, chasing exceptions, updating fields, and reconciling gaps
AI-native challengers can compete on a different axis:
one model of the business workflow
one place where context lives
automation that moves work forward across steps
handling exceptions without a human being the glue
That’s not “cheaper seats.” It’s a different product category: outcome-focused systems rather than tool-focused apps.
Why this hits SaaS valuations
If buyers shift from “best tool” to “best end-to-end outcome,” the SaaS moat changes:
Feature depth matters less than workflow ownership
Integrations matter less than shared context
UI matters less than automation and decisioning
Point solutions get re-framed as “components,” not “systems”
That’s exactly where multiples compress: when a market realises a product is becoming a replaceable module inside a bigger platform.
What to watch (the early signs)
Not “seat price down.” Look for:
new vendors winning by promising cycle-time reduction (close faster, ship faster, resolve faster)
incumbents expanding into adjacencies defensively (copying platform moves)
customers consolidating around process owners (systems of action), not systems of record
services headcount shifting from “ops glue” to “exception oversight”
Bottom line
AI isn’t just making software cheaper.
It’s enabling a change in what customers buy: solutions that map to the business, solve multiple connected problems, and reduce the need for humans to stitch workflows together.
That’s the Nokia Trap for SaaS: people keep asking for “better apps” right up until the product category shifts to “business platforms that run the work.”
“–” More exposed SaaS / app-layer
Salesforce (CRM) — CRM
ServiceNow — NOW
Workday — WDAY
Adobe — ADBE
Atlassian — TEAM
Snowflake — SNOW
Datadog — DDOG
HubSpot — HUBS
Zoom — ZM
DocuSign — DOCU
Okta — OKTA
Twilio — TWLO
Shopify — SHOP
Monday.com — MNDY
Asana — ASAN
Smartsheet — SMAR
PagerDuty — PD
Freshworks — FRSH
Elastic — ESTC
GitLab — GTLB
MongoDB — MDB
Cloudflare — NET
Unity — U
Toast — TOST
“+” Likely beneficiaries (AI platform / infra / “system-of-action” enablers)
3 min read | For investors tracking NVDA, hyperscalers, and AI infrastructure
Emerging AI architectures — particularly Mamba and State Space Models (SSMs) — threaten to disrupt the current AI landscape.
Both hardware and software leaders face risk, though hardware companies are more exposed: custom silicon takes 3-5 years to design, while model companies can retrain and pivot in 12-18 months.
The Game-Changer: Mamba and State Space Models
The transformer problem: Today’s AI models (GPT, Claude, Gemini) use “attention” — comparing every word to every other word. Double the context length, quadruple the compute.
That’s why long-context models are so expensive and why hyperscalers are spending hundreds of billions on GPU clusters.
The SSM solution: State Space Models process sequences like a running summary rather than looking at everything simultaneously.
Mamba — the leading SSM architecture, developed by researchers at Carnegie Mellon and Princeton — scales linearly with context length.
The impact:
✓ 5x faster on long sequences
✓ Fraction of the memory footprint
✓ Dramatically lower compute per token
Who’s backing it: Mistral (Codestral Mamba), AI21 Labs (Jamba), Together AI. Hybrid transformer-Mamba models are already in production.
The catch: Pure Mamba hasn’t matched transformers for complex reasoning at frontier scale — yet. But hybrids are proliferating, and the trajectory is clear.
What This Means for GPU Demand
If SSMs gain traction, the compute economics of AI change fundamentally.
Transformer world:
Compute scales quadratically with context
High memory per token
GPU hours: baseline
Long context: expensive, constrained
SSM world:
Compute scales linearly with context
Low memory per token
GPU hours: potentially 50-80% less
Long context: cheap, abundant
The demand question: Efficiency gains could reduce absolute GPU demand — or unlock new use cases that consume the savings. History suggests the latter, but the transition creates uncertainty.
The NVIDIA risk: SSMs still run on CUDA — but if you need 50-80% fewer GPUs per workload, that’s a volume problem even if NVIDIA keeps 100% share.
The $600 billion hyperscaler capex trajectory assumes insatiable compute demand. SSMs challenge that assumption.
The custom silicon risk: TPUs, Trainium, and MTIA are optimised for transformer attention patterns. SSMs have different compute profiles.
Billions in chips could become sub-optimal — and reduced compute demand means less need for any custom silicon.
Who’s Exposed, Who’s Protected
NVIDIA — Moderate exposure
Keeps architecture flexibility, but volume at risk if compute demand drops. Pricing power may erode.
Google, Amazon — High exposure
Custom silicon optimised for wrong architecture and potentially overbuilt for reduced demand. Double hit.
Microsoft — Hedged
NVIDIA dependency means less stranded silicon, but Azure capex still at risk.
Neo-Clouds (CRWV, NBIS) — High exposure
Leveraged to GPU demand. If demand drops 50%, the debt doesn’t.
OpenAI, Anthropic — Lower exposure
Compute costs drop. They’ll adopt what works. Net beneficiaries.
The Bottom Line
SSMs and Mamba may not kill transformers outright — hybrids are more likely.
But they rewrite the compute economics and challenge the “insatiable demand” narrative underlying current valuations.
NVIDIA keeps architectural flexibility but faces volume risk. Hyperscalers face both wrong-architecture risk and overbuilding risk. Neo-clouds are leveraged to a demand curve that may flatten.
The model companies may be the cleanest winners — their compute bills go down while their capabilities go up.
When efficiency improves dramatically, the biggest spenders have the most to lose.


FutureCompute has delivered +1.92% since inception, outperforming every benchmark tracked. QQQ fell 3.15%, the Nasdaq Composite (IXIC) −3.51%, and ARKK declined 12.84% over the same period — a combined alpha spread of up to +14.76pp vs ARKK.
The December trough (−2.88%, Dec 12) reflected sector-wide AI reassessment post-DeepSeek R1. The portfolio recovered decisively through January, peaking at +3.79% on Jan 16 as hyperscaler earnings confirmed sustained infrastructure commitment.
Google is the standout contributor — Gemini integration delivering measurable search and Cloud uplift. Microsoft has lagged on Copilot enterprise adoption but Azure AI remains structurally solid.